STEP #2 - MEASURE CON’T
DATA & SAMPLING


Step #2 - MEASURE CON’T
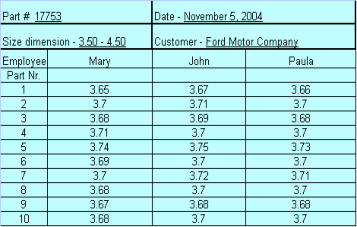
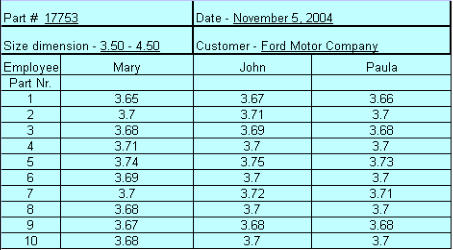
Validating the Measurement System: Gage R&R Step 3 of data collection is to validate the measurement system. The goal is to minimize the controllable factors that could either exaggerate or cloud the amount of variation in data. A Gage R&R is a set of trials conducted to assess the Repeatability and Reproducibility of your measurement system. The method consists of: Multiple operators measuring multiple units a multiple number of times. The AIAG standard Gage R&R format is for three operators to measure ten parts, ten times individually. To be effective, it is best that the operator does not know that the part being measured is a part of a special test. It is best if the parts are numbered and measured randomly, filling in the log sheet after each measurement. In this manner, the operator is not necessarily recalling what each individual measurement was. The operator is to go thru and measure all ten parts, record the readings, and then start over again in the same manner until this operation has been repeated three times. Two other operators will perform the same function. Or, three separate operators will each measure ten pieces once and each records their readings. An example chart is given below:As you can see, each operator had measured the same part differently, and while some
agree, some differ. The point is no two people are alike and there will be variation in the
way that a part is measured.
You analyze the variation in the study results to determine how much of it comes from
the differences within the operators, techniques or the measuring devices being utilized.
The common problems that are often experienced with measurement systems are:
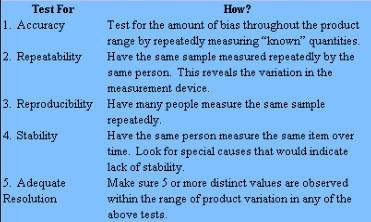
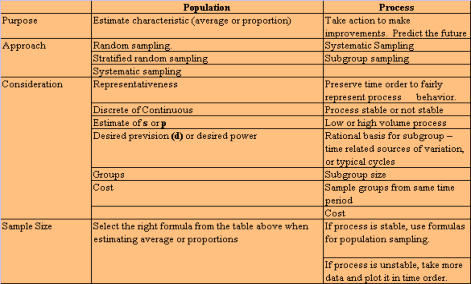
· Bias or inaccuracy - the measurements have a different average value than a "standard" method. · Imprecision - repeated readings on the same material vary too much in relation to the current process variation. · Not reproducible - the measurement process is different for different operators, or measuring devices or labs. This may be a difference in either precision, feel or bias. · Unstable measurement system over time - either the bias or the precision changes over time. · Lack of resolution - the measurement process cannot measure to the degree or precision to properly capture current product variation. Desired characteristics for continuous variables: Accuracy - the measured value has little deviation from the actual value. Accuracy is usually tested by comparing an average of repeated measurements to a known standard value for that unit. Repeatability - the same person taking a measurement on the same unit generally gets the exact same results. Reproducibility - other people get the same result you get when measuring the same item or characteristic. Stability - measurements taken by a single person in the same way vary little over time. Adequate resolution - there is enough resolution in the measurement device so that the product can have many different values. A measuring system operates best when it consists of: · Measuring devices · Procedures · Definitions · People To improve a measurement system, you need to: · Evaluate how well it works now (ask "how much of the variation we see in our data is due to the measurement system?) · Evaluate the results and develop improvement strategies. Ways to determine if the measurement system is adequate: Assessing the accuracy, repeatability, and reproducibility of a discrete measurement system. · Discrete data are usually the result of human judgment ("which category does this data belong in?") · When categorizing items (good/bad; short/long; etc.), you need a high degree of agreement on which way an item should be categorized. · The best way to assess human judgment is to have all operators categorize several known test units. In doing so, look for 100% agreement, and use the disagreements as opportunities to determine and eliminate any problems incurred. Step 4 of data collection is to actually begin to collect the data. The goal is to ensure a smooth start-up. It requires that you: · Train the data collectors on the methods to be used. · Error-proof data collection procedures. It helps to pilot and test the data collection forms and procedures. · Be there in the beginning, and monitor during the collection. · Decide how you will display the data after it is collected Step 5 is to Continue Improving Measurement Consistency. The goal is to check that data collection procedures are being followed and that changes are made as necessary to adapt to changing conditions. Questions you should ask are: · Are measurements consistent? How do you know? · Repeatable? · Reproducible? · Stable? · Do the data exhibit any strange features or readings? Developing A Sampling Strategy: Sampling is collecting a portion of all the data using that portion to draw conclusions with. Sound conclusions can often be drawn from a relatively small amount of data. We sample because looking at all the data may be quite expensive, too time-consuming, or possibly even destructive. Sampling is used in every phase of DMAIC where data is collected. The first question asked is "How many samples do we need to measure or collect data on?" The answer to that question is dependent upon four factors: · Type of data - discrete or continuous. · What you want to do with the data: - describe a characteristic for a whole group (mean or proportion)\; within a certain precision of +/- number of units? - Compare group characteristics (find differences between group means or proportions; at what power - the probability you want of detecting a certain difference?) · What you guess the standard deviation (or proportion) will be · How confident you want to be (usually 95%). There is a trade-off between precision, sample size, and cost in both dollars and time. The formulas for sample size were developed for population sampling. They can be applied to process sampling if the process is stable. Since most processes are not stable, the results of the formulas should be used as the lowest figure to be considered. The formulas are as follows: D = precision p = proportion N = sample size s = standard deviation For conclusions to be valid, samples must be representative. · Data should somewhat represent the process. · No systematic differences should exist between the data you collect and the data you don't collect. A representative sample requires some careful planning. You need to consider: · What groups to sample, and the proportion of each group in the sample. · When to sample and/or how often to sample. · Where to sample. In DMAIC we are usually sampling from a process. We want to ensure that we can see the behavior of the process, therefore we should: · Sample systematically or with subgroups (not randomly) across time. Systematic or subgroup sampling ensures the sample will be representative of the process because each time period is represented. · Try to sample from as many time periods as possible to fairly represent the process and the source of variation within the process. · Generally, collect small samples more frequently to ensure that the process behavior is represented properly over time. · Make a control chart of time plot to determine if the process is stable or unstable; that is, look for outliers, shifts, trends, runs or other patterns. Sampling Approaches Random Sampling - each unit has the same chance of being selected. Stratified Random Sampling - randomly sample a proportionate number from each group. Systematic Sampling - sample every "n "th part (for example, every third or every fourth part) Subgroup Sampling - sample "n" units every so often (for example, 3 units every hour or half-hour); then calculate the mean (proportion) for each subgroup. SUMMARY OF SAMPLING SITUATIONS Very often the initial data you collect during an improvement project will be continuous data that have a natural time order. The first step in analyzing time-ordered data is to create a time plot or control chart. The next step is to create a frequency plot (or histogram) of the data and analyze the distribution. If your data is not time-ordered, chances are you can use either a frequency plot or Pareto chart to analyze it. A frequency chart (see check sheets) shows the distribution of continuous numeric data. A Pareto chart (see Pareto diagram page) shows the relative frequency or impact of data that can be divided into categories. The goals of analyzing patterns in data are: · Understand the relationship between quality and variation. · Be able to differentiate between common and special cause variation. · Be able to create and interpret time plots, control charts, histograms and Pareto charts. · Understand the difference between control limits (process capability) and specification limits (customer requirements). Understanding Variation When analyzing time-ordered data, you also need to consider the variation, how the data values change from point to point. Certain patterns in the variation can provide clues about the source of the process problem. Let's first define what variation is: · Nothing is ever the same twice, or nothing is ever exactly alike. How a process runs will differ from day to day. Measurements or counts collected on a process output will vary over time as the process drifts. · Quantifying the amount of variation in a process is a critical step towards making improvements. · Understanding what causes that variation will help you to decide what kinds of action are needed to make a lasting or significant improvement; that is, one of a more permanent nature. The amount of variation in a process will tell you what the process is actually capable of attaining. Specifications tell you what you want a process to be able to achieve. Traditionally, any value that lies within the specification boundaries is considered to be a good part or process. However, reality is that at any point that a characteristic deviates from the targeted specification, or nominal target, there is some loss. The bigger the deviation, the bigger the loss. Variation in a process is generally considered to have been caused by one or two reasons, or "causes". They are termed "special" and "common" causes. Special Cause variation means that something different has occurred at a certain time or place within the process. Common Cause variation is always present to some degree in the process. The goal is minimize the variation. It is important to distinguish between special and common cause variation, because each requires a different strategy. Special cause strategy is to: · Get timely data. · Take immediate action to remedy any damage. · Immediately search for the cause. Find out what was different on that occasion. Isolate the deepest cause that you can determine and that will have the greatest effect. · Develop a longer-term remedy that will prevent that special cause from recurring. Or, if results are good, retain that for a lesson learned and record it in a "Lessons Learned" logbook Common cause strategy is improving a stable process. The process can be stable, and still not meet customer needs. Attempting to explain the difference between individual points if the process is in statistical control can hardly ever reduce common causes of variation. All the data are relevant. A process in statistical control usually requires some form of fundamental change for improvement. Using the DMAIC method can help you make a fundamental change in the process. Effective improvement relies on being able to distinguish common cause variation from special cause variation. Note that if you treat special causes like common causes, you will lose an opportunity to track down and eliminate something specific that is increasing the variation within the process. If you treat common causes like special causes, you will most likely end up increasing the variation. Therefore, taking the wrong action, not only does not improve the situation or the variation, it instead often makes the situation even worse. CONTINUE TO PART THREE OF MEASURE NEXT- - PART THREE
© The Quality Web, authored by Frank E. Armstrong, Making Sense Chronicles - 2003 - 2016


STEP #2 - MEASURE CON’T
DATA & SAMPLING

Step #2 - MEASURE CON’T
Validating the Measurement System: Gage R&R Step 3 of data collection is to validate the measurement system. The goal is to minimize the controllable factors that could either exaggerate or cloud the amount of variation in data. A Gage R&R is a set of trials conducted to assess the Repeatability and Reproducibility of your measurement system. The method consists of: Multiple operators measuring multiple units a multiple number of times. The AIAG standard Gage R&R format is for three operators to measure ten parts, ten times individually. To be effective, it is best that the operator does not know that the part being measured is a part of a special test. It is best if the parts are numbered and measured randomly, filling in the log sheet after each measurement. In this manner, the operator is not necessarily recalling what each individual measurement was. The operator is to go thru and measure all ten parts, record the readings, and then start over again in the same manner until this operation has been repeated three times. Two other operators will perform the same function. Or, three separate operators will each measure ten pieces once and each records their readings. An example chart is given below:As you can see, each operator had measured the
same part differently, and while some agree,
some differ. The point is no two people are alike
and there will be variation in the way that a part is
measured.
You analyze the variation in the study results to
determine how much of it comes from the
differences within the operators, techniques or
the measuring devices being utilized. The
common problems that are often experienced
with measurement systems are:
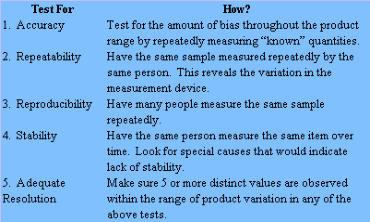
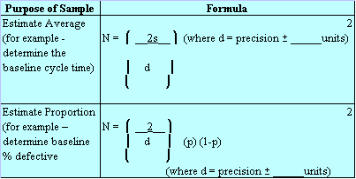
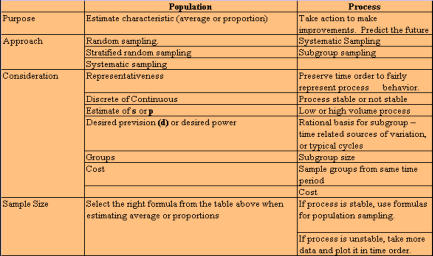
· Bias or inaccuracy - the measurements have a different average value than a "standard" method. · Imprecision - repeated readings on the same material vary too much in relation to the current process variation. · Not reproducible - the measurement process is different for different operators, or measuring devices or labs. This may be a difference in either precision, feel or bias. · Unstable measurement system over time - either the bias or the precision changes over time. · Lack of resolution - the measurement process cannot measure to the degree or precision to properly capture current product variation. Desired characteristics for continuous variables: Accuracy - the measured value has little deviation from the actual value. Accuracy is usually tested by comparing an average of repeated measurements to a known standard value for that unit. Repeatability - the same person taking a measurement on the same unit generally gets the exact same results. Reproducibility - other people get the same result you get when measuring the same item or characteristic. Stability - measurements taken by a single person in the same way vary little over time. Adequate resolution - there is enough resolution in the measurement device so that the product can have many different values. A measuring system operates best when it consists of: · Measuring devices · Procedures · Definitions · People To improve a measurement system, you need to: · Evaluate how well it works now (ask "how much of the variation we see in our data is due to the measurement system?) · Evaluate the results and develop improvement strategies. Ways to determine if the measurement system is adequate: Assessing the accuracy, repeatability, and reproducibility of a discrete measurement system. · Discrete data are usually the result of human judgment ("which category does this data belong in?") · When categorizing items (good/bad; short/long; etc.), you need a high degree of agreement on which way an item should be categorized. · The best way to assess human judgment is to have all operators categorize several known test units. In doing so, look for 100% agreement, and use the disagreements as opportunities to determine and eliminate any problems incurred. Step 4 of data collection is to actually begin to collect the data. The goal is to ensure a smooth start-up. It requires that you: · Train the data collectors on the methods to be used. · Error-proof data collection procedures. It helps to pilot and test the data collection forms and procedures. · Be there in the beginning, and monitor during the collection. · Decide how you will display the data after it is collected Step 5 is to Continue Improving Measurement Consistency. The goal is to check that data collection procedures are being followed and that changes are made as necessary to adapt to changing conditions. Questions you should ask are: · Are measurements consistent? How do you know? · Repeatable? · Reproducible? · Stable? · Do the data exhibit any strange features or readings? Developing A Sampling Strategy: Sampling is collecting a portion of all the data using that portion to draw conclusions with. Sound conclusions can often be drawn from a relatively small amount of data. We sample because looking at all the data may be quite expensive, too time-consuming, or possibly even destructive. Sampling is used in every phase of DMAIC where data is collected. The first question asked is "How many samples do we need to measure or collect data on?" The answer to that question is dependent upon four factors: · Type of data - discrete or continuous. · What you want to do with the data: - describe a characteristic for a whole group (mean or proportion)\; within a certain precision of +/- number of units? - Compare group characteristics (find differences between group means or proportions; at what power - the probability you want of detecting a certain difference?) · What you guess the standard deviation (or proportion) will be · How confident you want to be (usually 95%). There is a trade-off between precision, sample size, and cost in both dollars and time. The formulas for sample size were developed for population sampling. They can be applied to process sampling if the process is stable. Since most processes are not stable, the results of the formulas should be used as the lowest figure to be considered. The formulas are as follows: D = precision p = proportion N = sample size s = standard deviation For conclusions to be valid, samples must be representative. · Data should somewhat represent the process. · No systematic differences should exist between the data you collect and the data you don't collect. A representative sample requires some careful planning. You need to consider: · What groups to sample, and the proportion of each group in the sample. · When to sample and/or how often to sample. · Where to sample. In DMAIC we are usually sampling from a process. We want to ensure that we can see the behavior of the process, therefore we should: · Sample systematically or with subgroups (not randomly) across time. Systematic or subgroup sampling ensures the sample will be representative of the process because each time period is represented. · Try to sample from as many time periods as possible to fairly represent the process and the source of variation within the process. · Generally, collect small samples more frequently to ensure that the process behavior is represented properly over time. · Make a control chart of time plot to determine if the process is stable or unstable; that is, look for outliers, shifts, trends, runs or other patterns. Sampling Approaches Random Sampling - each unit has the same chance of being selected. Stratified Random Sampling - randomly sample a proportionate number from each group. Systematic Sampling - sample every "n "th part (for example, every third or every fourth part) Subgroup Sampling - sample "n" units every so often (for example, 3 units every hour or half- hour); then calculate the mean (proportion) for each subgroup. SUMMARY OF SAMPLING SITUATIONS Very often the initial data you collect during an improvement project will be continuous data that have a natural time order. The first step in analyzing time-ordered data is to create a time plot or control chart. The next step is to create a frequency plot (or histogram) of the data and analyze the distribution. If your data is not time-ordered, chances are you can use either a frequency plot or Pareto chart to analyze it. A frequency chart (see check sheets) shows the distribution of continuous numeric data. A Pareto chart (see Pareto diagram page) shows the relative frequency or impact of data that can be divided into categories. The goals of analyzing patterns in data are: · Understand the relationship between quality and variation. · Be able to differentiate between common and special cause variation. · Be able to create and interpret time plots, control charts, histograms and Pareto charts. · Understand the difference between control limits (process capability) and specification limits (customer requirements). Understanding Variation When analyzing time-ordered data, you also need to consider the variation, how the data values change from point to point. Certain patterns in the variation can provide clues about the source of the process problem. Let's first define what variation is: · Nothing is ever the same twice, or nothing is ever exactly alike. How a process runs will differ from day to day. Measurements or counts collected on a process output will vary over time as the process drifts. · Quantifying the amount of variation in a process is a critical step towards making improvements. · Understanding what causes that variation will help you to decide what kinds of action are needed to make a lasting or significant improvement; that is, one of a more permanent nature. The amount of variation in a process will tell you what the process is actually capable of attaining. Specifications tell you what you want a process to be able to achieve. Traditionally, any value that lies within the specification boundaries is considered to be a good part or process. However, reality is that at any point that a characteristic deviates from the targeted specification, or nominal target, there is some loss. The bigger the deviation, the bigger the loss. Variation in a process is generally considered to have been caused by one or two reasons, or "causes". They are termed "special" and "common" causes. Special Cause variation means that something different has occurred at a certain time or place within the process. Common Cause variation is always present to some degree in the process. The goal is minimize the variation. It is important to distinguish between special and common cause variation, because each requires a different strategy. Special cause strategy is to: · Get timely data. · Take immediate action to remedy any damage. · Immediately search for the cause. Find out what was different on that occasion. Isolate the deepest cause that you can determine and that will have the greatest effect. · Develop a longer-term remedy that will prevent that special cause from recurring. Or, if results are good, retain that for a lesson learned and record it in a "Lessons Learned" logbook Common cause strategy is improving a stable process. The process can be stable, and still not meet customer needs. Attempting to explain the difference between individual points if the process is in statistical control can hardly ever reduce common causes of variation. All the data are relevant. A process in statistical control usually requires some form of fundamental change for improvement. Using the DMAIC method can help you make a fundamental change in the process. Effective improvement relies on being able to distinguish common cause variation from special cause variation. Note that if you treat special causes like common causes, you will lose an opportunity to track down and eliminate something specific that is increasing the variation within the process. If you treat common causes like special causes, you will most likely end up increasing the variation. Therefore, taking the wrong action, not only does not improve the situation or the variation, it instead often makes the situation even worse. CONTINUE TO PART THREE OF MEASURE NEXT- - PART THREE
© The Quality Web, authored by Frank E. Armstrong, Making Sense
Chronicles - 2003 - 2016