STEP #2 - MEASURE
DATA & SAMPLING


Step #2 - MEASURE
In the Define phase a team charter was produced, an overview of the process to be improved, and information was established on what is critical to quality of the customers. Probably the largest segment of information is within this step. In this phase, the goal is to pinpoint the location or source of the problem as precisely as possible by building a factual understanding of existing process conditions and problems. Having this knowledge will assist you in narrowing the range of potential causes that are needed to investigate in the Analyze phase. Therefore, the important function of the MEASURE phase is to establish a baseline capability level. The tools that are most commonly utilized in the Measure phase are: 1. Data Collection Plan 2. Data Collection Forms 3. Control Charts 4. Frequency plots 5. Gage R&R 6. Pareto Charts 7. Prioritization Matrix 8. Failure Mode and Effects Analysis 9. Process Capability 10. Process Sigma 11. Sampling 12. Stratification 13. Time Series Plots (Run Charts) In some cases, where I have these items already available on this web site, I will direct you back to the place on this web site where this tool can be found. If the context of the tool is not logical within this segment, I will also direct you to another page within this web site rather than take up extensive room on this phase space. In both cases, watch for a notation that states, "For an Example, Click Here" that will direct you to the relevant tool.DATA COLLECTION
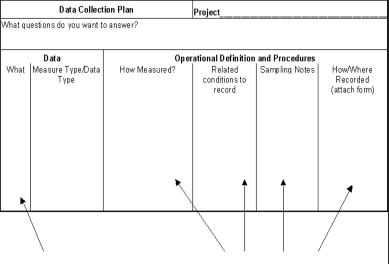
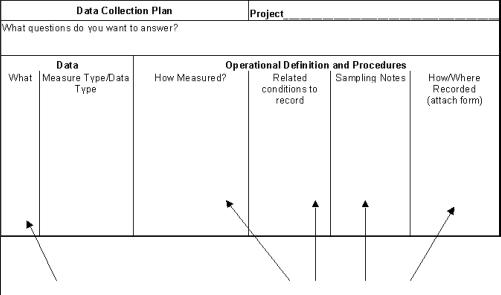
In planning for data collection it is important to: � Be able to identify possible measures. � Know how to select the most important variables to measure. � Know how to create a data collection plan. � Be able to identify stratification factors for a given problem. � Know the various types of data available. � Be able to create and use operational definitions. � Be able to create a useful data collection form, whether variable or attribute. Desired data characteristics need to be: � Sufficient � Relevant � Representative � ContextualOne of the most important things a team can do in planning for data collection is to draw
and label the graph that will communicate the findings properly before the collection
process begins. This points you to exactly what type of data you will need; that is, in
order to be able to effectively collect data, you have to know what it is you are trying to
illustrate. Additionally, it also raises questions that you may not have considered and
need to add to your plan.
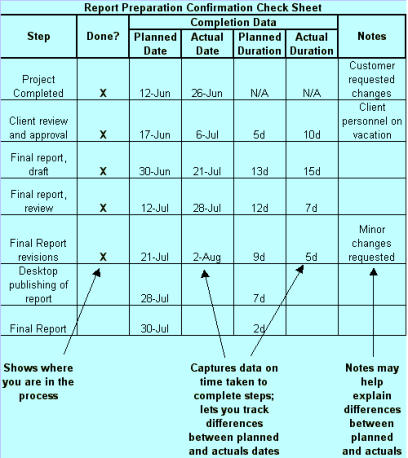
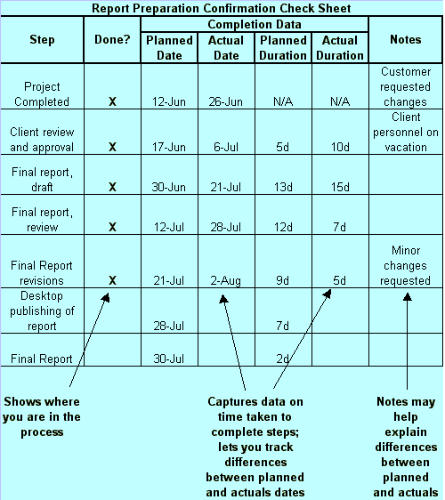
Some of the types of data collection forms that you can use are here on this web site at: Recording what data you are going to collect reminds you what you want to accomplish. Noting the type of data helps you decide how you should analyze the data. An operational definition defines exactly how you will go about collecting and recording the data. How will you ensure consistency? What will you do to make sure the data collected at one point in time is comparable to the data collected at other times to ensure that there is no bias introduced to skew the results or give a false impression of the overall problem plan. What is your plan for starting data collection? Just how will you go about collecting the data? Thinking about how you will display the data will help you make sure you are getting the right kind of data to answer the question you have in mind. See Section on CheckSheets - Click Here. IDENTIFY KEY MEASURES & CLARIFY GOALS The goal here is to make sure that the data you collect will give you the answers that you need. The "right" information: describes the problem you're studying; describes related conditions that might provide clues about causes; can be analyzed in ways that answer your questions. In the equation Y = f(X1, X2, X3, . . . . . Xn), Y relates to the process output. It tells us how well we are meeting customer needs. X relates to the various input and process variables. You need to gain this knowledge in order to improve the process. Understanding the variation in the output variable (Y) requires data relative to the X's. Since data collection can consume a tremendous amount of time, it is critical to focus on the key measures. The high-level SIPOC map provides a starting point for identifying possible measures. Prioritization Matrix - There are two applications for a prioritization matrix: 1. Linking out variables to customer requirements, and 2. Linking input and process variables to output variables. The second application is used for identifying key measures. Why use a prioritization matrix? � To identify the critical few variables that needs to be measured and analyzed. � To help to focus the data collection effort. � To help formulate theories about causes and effects. When to use a prioritization matrix: � There are too many variables that might have an impact on the output of the process. � Collecting data about all possible variables would cost too much time and money. � Team members have different theories about what happens in the process. How to construct a prioritization matrix: 1. List all output variables. 2. Rank and weight the output variables. 3. List all input and process variables. 4. Evaluate the strength of the relationship between output and input/process variable (correlation factor). 5. Cross-multiply weight and correlation factor. 6. Highlight the critical few variables. F M E A Failure Mode and Effect Analysis (FMEA) is another tool that can be used to help focus on data collection efforts for the input and process variables that are critical for the current process. Therefore, it can be used in the Measure phase as well as the Improve phase since it is a structure approach to identify, estimate, prioritize and evaluate risk. The entire purpose of the FMEA is to prevent failures from occurring, and what the effects are should a failure occur. Why use an FMEA? � Identifies the critical input and process variables that can affect output quality. � Establishes priorities and guides the data collection effort. � Evaluates the risk associated with defects. � Helps to formulate assumptions about the relationship between variables. When to use an FMEA? � Lack of clarity about what the important variables are and how they affect output quality. � Need to prioritize data collection efforts. How to Construct an FMEA: 1. Identify potential failure modes - ways in which the product, service, or process might fail. 2. Identify potential effect of each failure (consequences of that failure) and rate the severity. 3. Identify causes of the effects and rate their likelihood of occurrence. 4. Rate you ability to detect each failure mode. 5. Multiply the three numbers together to determine the risk of each failure mode (RPN = Risk Priority Number). 6. Identify ways to reduce or eliminate risk associated with high RPN numbered items. You can download a sample FMEA form in Adobe format (.pdf), as well as other information and books on FMEA's, from: http://www.fmeainfocentre.com The next question you might ask yourself is how does one determine what numbers are to be placed into the boxes for Severity, Occurrence and Detection? Are they just random numbers selected without rhyme or reason? Not at all, the Automotive Industry Action Group (AIAG) has created an FMEA manual that is linked to ISO9001: TS16949 standards, and within that book are tabled guidelines for how to determine the correct number to place in each segment, predicated on certain criteria. I have placed a sample FMEA (CLICK HERE) for your review and understanding. At this next link, ( R P Ns) CLICK HERE you will find the tables that list the criteria for each of the categories mentioned above, to enable you to decide how to place the RPN numbers in each category. If you have further questions regarding FMEA number assignments, you may visit FMEA Info for clarification or further knowledge. Stratification - dividing data into groups (strata) based upon key characteristics. A "key characteristic" is some aspect of the data that you think could help explain when, where, and why a problem exists. The purpose of dividing the data into groups is to detect a pattern that localizes a problem or explains why the frequency of impact varies between times, locations, or conditions. Ways to stratify date - typically the data groups are based upon: � WHO - which people, groups of people, departments or organization are involved. � WHAT - machines, equipment, products, services, suppliers. � WHERE - physical location of the defect. � WHEN - time of day, day of the week, step of the process. In the Analyze phase, you will see how to analyze stratified data. By visiting the CHECK SHEET examples within this web site, you will see how you can stratify data as you collect, and thus give a visual representation indicating where the problems lie while representing your data in a graphical form. There are basically two types of data: 1. Continuous Data - often obtained by the use of a measuring system. The usefulness of the data depends on the quality of the measurement system. Counts of non-occurrences are best treated as continuous data. 2. Discrete Data - includes percentages, counts, attributes and ordinals. Percentages equal the proportion of items with a given characteristic; need to be able to count both occurrences and non-occurrences. For count data, it is impossible or impractical to count a non-occurrence; the event must be rare. Occurrences must be independent. Some Examples for Data Stratification are: Continuous or "variable" - Measuring instrument or calculation � Service - elapsed time to complete transaction, average length of phone call � Manufacturing - elapsed cycle time, gauge production rates, weight, length, speed � Both - budget vs. actual in dollars; average customer satisfaction score; amount purchased Discrete: Percentage or Proportion - Count occurrences and non-occurrences � Service - proportion of late applications, incorrect invoices. � Manufacturing - proportion of defective items, reworked items, damaged items, late shipments � Both - proportion of employees absent, incomplete orders Discrete: Count - court occurrences in an area of opportunity � Service - number of applications, errors, complaints, etc. � Manufacturing - number of computer malfunctions, machine breakdowns, employee accidents, etc. Discrete: Attribute - observations � Service - type of applications or type of requests � Manufacturing - type of products or defects � Both - type of customer, type of method used, location of activity Discrete: Ordinal - observation or ranking � Both - customer rating (scale of 1 to 5); day of the week (M-F); date, time order OPERATIONAL DEFINITIONS The next step in data collection is to develop operational definitions and procedures. The goal is to make sure all the data collectors measure a characteristic universally, that is, in the same manner and method. This prevents variation and confusion in the measurements. An operational definition is a precise description that explains how to get a value for the characteristic that you are trying to measure and record. It includes what something is and how it should be measured. The features you want to include in an operational definition are: � Must be specific and definable in simple terms � Must be measurable, whether a variable measurement or an attribute � Must be useful to both you and your customer, and therefore quantifiable � There is no single right answer, it is measured how it is - within or outside of specification; pass or fail; go or no-go. The more specific the definition is, the better the results will be. Plan on refining the definition after you try it out. Have those who are going to do the measuring read the definition and ensure they understand what the measurement results are to be and how to properly obtain the measurements you want to get. If you collect the data manually, you will need to train the data collectors consistently to ensure the measurements are made in the same way. With calipers, for instance, there is always the variable of whether it is a tight or loose fit. The same applies to pin gauges; is it to be a snug fit or loose fit? DATA COLLECTION FORMS - Check sheets are basic forms that help standardize the data collection process by providing specific spaces where people are to record the data. Again, I refer you to the Check Sheet page within this web site for a better understanding and sample format. By viewing this Check Sheet site, you can see the different types of check sheets that are available, depending upon the type of measurement you set out to accomplish. A FREQUENCY PLOT check sheet is a special type of check sheet that is used to record for numerical data. As you plot, you are actually creating a picture that shows how often different values appear. Another type of check sheet that can be used that is not on this web site is a Confirmation Check Sheet. This is a special type that is used to confirm that steps in a process have been completed and to collect the data on time taken in different process steps. An Example is given below: CONTINUE TO PART TWO OF MEASURE NEXT- - PART TWO
© The Quality Web, authored by Frank E. Armstrong, Making Sense Chronicles - 2003 - 2016


STEP #2 - MEASURE
DATA & SAMPLING

Step #2 - MEASURE
In the Define phase a team charter was produced, an overview of the process to be improved, and information was established on what is critical to quality of the customers. Probably the largest segment of information is within this step. In this phase, the goal is to pinpoint the location or source of the problem as precisely as possible by building a factual understanding of existing process conditions and problems. Having this knowledge will assist you in narrowing the range of potential causes that are needed to investigate in the Analyze phase. Therefore, the important function of the MEASURE phase is to establish a baseline capability level. The tools that are most commonly utilized in the Measure phase are: 1. Data Collection Plan 2. Data Collection Forms 3. Control Charts 4. Frequency plots 5. Gage R&R 6. Pareto Charts 7. Prioritization Matrix 8. Failure Mode and Effects Analysis 9. Process Capability 10. Process Sigma 11. Sampling 12. Stratification 13. Time Series Plots (Run Charts) In some cases, where I have these items already available on this web site, I will direct you back to the place on this web site where this tool can be found. If the context of the tool is not logical within this segment, I will also direct you to another page within this web site rather than take up extensive room on this phase space. In both cases, watch for a notation that states, "For an Example, Click Here" that will direct you to the relevant tool.DATA COLLECTION
In planning for data collection it is important to: � Be able to identify possible measures. � Know how to select the most important variables to measure. � Know how to create a data collection plan. � Be able to identify stratification factors for a given problem. � Know the various types of data available. � Be able to create and use operational definitions. � Be able to create a useful data collection form, whether variable or attribute. Desired data characteristics need to be: � Sufficient � Relevant � Representative � ContextualOne of the most important things a team can do
in planning for data collection is to draw and label
the graph that will communicate the findings
properly before the collection process begins. This
points you to exactly what type of data you will
need; that is, in order to be able to effectively
collect data, you have to know what it is you are
trying to illustrate. Additionally, it also raises
questions that you may not have considered and
need to add to your plan.
Some of the types of data collection forms that you can use are here on this web site at: Recording what data you are going to collect reminds you what you want to accomplish. Noting the type of data helps you decide how you should analyze the data. An operational definition defines exactly how you will go about collecting and recording the data. How will you ensure consistency? What will you do to make sure the data collected at one point in time is comparable to the data collected at other times to ensure that there is no bias introduced to skew the results or give a false impression of the overall problem plan. What is your plan for starting data collection? Just how will you go about collecting the data? Thinking about how you will display the data will help you make sure you are getting the right kind of data to answer the question you have in mind. See Section on CheckSheets - Click Here. IDENTIFY KEY MEASURES & CLARIFY GOALS The goal here is to make sure that the data you collect will give you the answers that you need. The "right" information: describes the problem you're studying; describes related conditions that might provide clues about causes; can be analyzed in ways that answer your questions. In the equation Y = f(X1, X2, X3, . . . . . Xn), Y relates to the process output. It tells us how well we are meeting customer needs. X relates to the various input and process variables. You need to gain this knowledge in order to improve the process. Understanding the variation in the output variable (Y) requires data relative to the X's. Since data collection can consume a tremendous amount of time, it is critical to focus on the key measures. The high-level SIPOC map provides a starting point for identifying possible measures. Prioritization Matrix - There are two applications for a prioritization matrix: 1. Linking out variables to customer requirements, and 2. Linking input and process variables to output variables. The second application is used for identifying key measures. Why use a prioritization matrix? � To identify the critical few variables that needs to be measured and analyzed. � To help to focus the data collection effort. � To help formulate theories about causes and effects. When to use a prioritization matrix: � There are too many variables that might have an impact on the output of the process. � Collecting data about all possible variables would cost too much time and money. � Team members have different theories about what happens in the process. How to construct a prioritization matrix: 1. List all output variables. 2. Rank and weight the output variables. 3. List all input and process variables. 4. Evaluate the strength of the relationship between output and input/process variable (correlation factor). 5. Cross-multiply weight and correlation factor. 6. Highlight the critical few variables. F M E A Failure Mode and Effect Analysis (FMEA) is another tool that can be used to help focus on data collection efforts for the input and process variables that are critical for the current process. Therefore, it can be used in the Measure phase as well as the Improve phase since it is a structure approach to identify, estimate, prioritize and evaluate risk. The entire purpose of the FMEA is to prevent failures from occurring, and what the effects are should a failure occur. Why use an FMEA? � Identifies the critical input and process variables that can affect output quality. � Establishes priorities and guides the data collection effort. � Evaluates the risk associated with defects. � Helps to formulate assumptions about the relationship between variables. When to use an FMEA? � Lack of clarity about what the important variables are and how they affect output quality. � Need to prioritize data collection efforts. How to Construct an FMEA: 1. Identify potential failure modes - ways in which the product, service, or process might fail. 2. Identify potential effect of each failure (consequences of that failure) and rate the severity. 3. Identify causes of the effects and rate their likelihood of occurrence. 4. Rate you ability to detect each failure mode. 5. Multiply the three numbers together to determine the risk of each failure mode (RPN = Risk Priority Number). 6. Identify ways to reduce or eliminate risk associated with high RPN numbered items. You can download a sample FMEA form in Adobe format (.pdf), as well as other information and books on FMEA's, from: http://www.fmeainfocentre.com The next question you might ask yourself is how does one determine what numbers are to be placed into the boxes for Severity, Occurrence and Detection? Are they just random numbers selected without rhyme or reason? Not at all, the Automotive Industry Action Group (AIAG) has created an FMEA manual that is linked to ISO9001: TS16949 standards, and within that book are tabled guidelines for how to determine the correct number to place in each segment, predicated on certain criteria. I have placed a sample FMEA (CLICK HERE) for your review and understanding. At this next link, ( R P Ns) CLICK HERE you will find the tables that list the criteria for each of the categories mentioned above, to enable you to decide how to place the RPN numbers in each category. If you have further questions regarding FMEA number assignments, you may visit FMEA Info for clarification or further knowledge. Stratification - dividing data into groups (strata) based upon key characteristics. A "key characteristic" is some aspect of the data that you think could help explain when, where, and why a problem exists. The purpose of dividing the data into groups is to detect a pattern that localizes a problem or explains why the frequency of impact varies between times, locations, or conditions. Ways to stratify date - typically the data groups are based upon: � WHO - which people, groups of people, departments or organization are involved. � WHAT - machines, equipment, products, services, suppliers. � WHERE - physical location of the defect. � WHEN - time of day, day of the week, step of the process. In the Analyze phase, you will see how to analyze stratified data. By visiting the CHECK SHEET examples within this web site, you will see how you can stratify data as you collect, and thus give a visual representation indicating where the problems lie while representing your data in a graphical form. There are basically two types of data: 1. Continuous Data - often obtained by the use of a measuring system. The usefulness of the data depends on the quality of the measurement system. Counts of non-occurrences are best treated as continuous data. 2. Discrete Data - includes percentages, counts, attributes and ordinals. Percentages equal the proportion of items with a given characteristic; need to be able to count both occurrences and non-occurrences. For count data, it is impossible or impractical to count a non-occurrence; the event must be rare. Occurrences must be independent. Some Examples for Data Stratification are: Continuous or "variable" - Measuring instrument or calculation � Service - elapsed time to complete transaction, average length of phone call � Manufacturing - elapsed cycle time, gauge production rates, weight, length, speed � Both - budget vs. actual in dollars; average customer satisfaction score; amount purchased Discrete: Percentage or Proportion - Count occurrences and non-occurrences � Service - proportion of late applications, incorrect invoices. � Manufacturing - proportion of defective items, reworked items, damaged items, late shipments � Both - proportion of employees absent, incomplete orders Discrete: Count - court occurrences in an area of opportunity � Service - number of applications, errors, complaints, etc. � Manufacturing - number of computer malfunctions, machine breakdowns, employee accidents, etc. Discrete: Attribute - observations � Service - type of applications or type of requests � Manufacturing - type of products or defects � Both - type of customer, type of method used, location of activity Discrete: Ordinal - observation or ranking � Both - customer rating (scale of 1 to 5); day of the week (M-F); date, time order OPERATIONAL DEFINITIONS The next step in data collection is to develop operational definitions and procedures. The goal is to make sure all the data collectors measure a characteristic universally, that is, in the same manner and method. This prevents variation and confusion in the measurements. An operational definition is a precise description that explains how to get a value for the characteristic that you are trying to measure and record. It includes what something is and how it should be measured. The features you want to include in an operational definition are: � Must be specific and definable in simple terms � Must be measurable, whether a variable measurement or an attribute � Must be useful to both you and your customer, and therefore quantifiable � There is no single right answer, it is measured how it is - within or outside of specification; pass or fail; go or no-go. The more specific the definition is, the better the results will be. Plan on refining the definition after you try it out. Have those who are going to do the measuring read the definition and ensure they understand what the measurement results are to be and how to properly obtain the measurements you want to get. If you collect the data manually, you will need to train the data collectors consistently to ensure the measurements are made in the same way. With calipers, for instance, there is always the variable of whether it is a tight or loose fit. The same applies to pin gauges; is it to be a snug fit or loose fit? DATA COLLECTION FORMS - Check sheets are basic forms that help standardize the data collection process by providing specific spaces where people are to record the data. Again, I refer you to the Check Sheet page within this web site for a better understanding and sample format. By viewing this Check Sheet site, you can see the different types of check sheets that are available, depending upon the type of measurement you set out to accomplish. A FREQUENCY PLOT check sheet is a special type of check sheet that is used to record for numerical data. As you plot, you are actually creating a picture that shows how often different values appear. Another type of check sheet that can be used that is not on this web site is a Confirmation Check Sheet. This is a special type that is used to confirm that steps in a process have been completed and to collect the data on time taken in different process steps. An Example is given below: CONTINUE TO PART TWO OF MEASURE NEXT- - PART TWO
© The Quality Web, authored by Frank E. Armstrong, Making Sense
Chronicles - 2003 - 2016