Lesson #7 - Tool #4 - Ishikawa Diagram
The best problem solving tool - the “Fishbone” or
Cause-and-Effect Diagram


© The Quality Web, authored by Frank E. Armstrong, Making Sense Chronicles - 2003 - 2016
THE POWER OF THE ISHIKAWA DIAGRAM
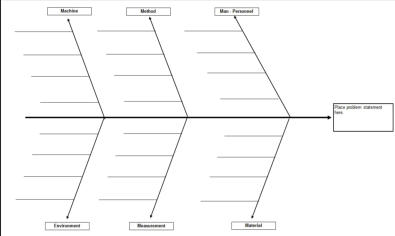
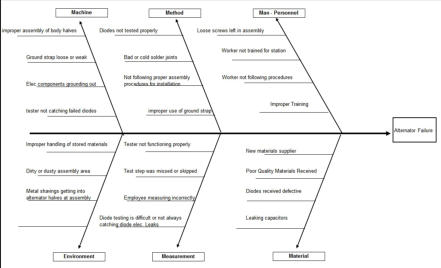
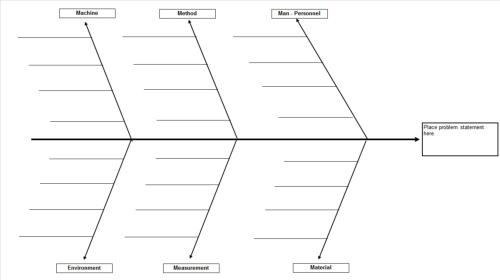
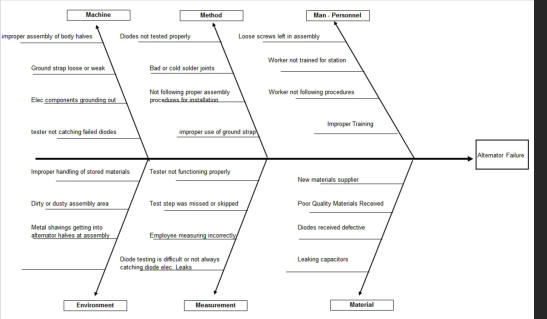
After collecting data from a process, and then preparing a pareto or histogram diagram, it's time to consider the reasons for the variation and those defects created. This data collected will reveal that items produced do not always turn out the same on a consistent basis. That is, parts produced can vary from production line to production line, from day shift to night shift, and from day to day, and so forth. In other words, you seldom get consistent parts produced every time. What causes these differences, or variation within the process? Basically, the variation created can originate from one or more of the following sources: 1. Raw Materials 2. Machinery, equipment or tooling 3. Work method or process 4. Work force - new people, trained different, etc. 5. Measurement method, or inconsistency in ways of measurement 6. Environment - high humidity, cold temperatures, dust, etc. The real problem becomes which one of the above factors is either totally, mostly, or somewhat responsible for the cause of our problem? Or is it a combination of several causes? A Cause-and-Effect diagram is useful in sorting out the causes of dispersion and organizing mutual relationships. This is an excellent team problem solving tool, where a team can gather together to "brain storm" the potential causes and resolutions to solve the variation problem. If you have not read the Introduction to Team Dynamics and Data Collection sections within this web site, I suggest you do so before proceeding further here. The Cause-and-Effect Diagram was created by Dr. Kaoru Ishikawa, an engineer and professor in Japan. The Cause-and-Effect Diagram is also referred to as a "Fishbone" diagram, getting the name from its resemblance to a fish skeleton when created. The main purpose of this diagram is to define a problem, identify a possible cause, isolate the cause, and then develop a solution. Below is an example of a generic Cause-and- Effect Diagram. STEPS TO CREATING A CAUSE-AND-EFFECT DIAGRAM When creating a "fishbone" diagram, each "vertebrate" is a section of one of 6 Basic categories. Once a main "fishbone" with six "bones" is created, each individual "bone" or section, can then be broken down further into another "fishbone" of individual items for analysis. The 6 basic categories are easily remembered from the anagram "5 ME". These basic categories are: 1. MAN - Does the operator have the proper training, experience, and ability to perform the function? 2. METHOD - Are the work instructions available and up-to-date? Do they reflect the best method to perform the task? Are the proper tools available? Are the process parameters specified clearly? 3. MACHINE - Does the machine have the capability to produce the product as specified? Does the machine have the ability to produce the product on a consistent basis? Are there regular routine maintenance and preventative maintenance tasks? Are they performed according to schedule? 4. MATERIAL - Are the correct materials available for the process? What is the quality of the material used in the process? Is there more than one supplier and does quality vary with different suppliers? What types of material problems could exist? 5. MEASUREMENT - Are the measurement instruments adequate for the process? Are they maintained correctly and regularly calibrated? Are the measurement instruments affected by environmental conditions such as temperature, vibration, dirt, etc.? 6. ENVIRONMENT - Is the manufacturing environment affected by temperature, humidity, dust and dirt, power fluctuations or seasonal differences? It is worth noting that within the measurement category, there can be variances. For example, the way one individual handles calipers and measures may differ from the next individual. It is important to have a training class for those who measure, to make the method of measurement consistent between all operators. Inconsistent measurement techniques can often lead you to believe that there are problems in the process, that may not actually exist. STEPS TO MAKING A TEAM CAUSE-AND-EFFECT DIAGRAM Again I recommend reviewing the Team Dynamics Introduction at the beginning of this web site. While one person can sit down and construct a "fishbone" diagram and go through the functions, it is wiser to form a team to "brain storm" the process. Gathering a cross-functional team of 4 - 7 individuals is the best and recommended process. It is also useful to include a "neutral" person who is not familiar with the process. The reason for that is this person will try to familiarize themself with the process, and in doing so, ask many questions that may spark an idea amongst the group. This neutral person may also present ideas and viewpoints that others may not consider. Appoint someone to be in charge of drawing the diagram. It is recommended that you use either a drawing board, a flip chart, or gather some large poster paper to draw the diagram on. You may also utilize "Post-It" Notes on a wall, if none of the above items are available, laying those post-its out in a fishbone arrangement. Whatever method you choose, it should be available for all to see. GETTING STARTED 1. First, formulate the problem and write it in a box on the right side of the diagram. Everyone must clearly understand the nature of the problem and the process/product being discussed. If everyone is not clear on the purpose of the session, the session will not resolve the problem. 2. Next, draw an arrow from the left side of your chart or board, over to the right side and make and arrowhead point. To the right of the arrowhead, place your "problem" topic. This arrow is called the "EFFECT" arrow. 3. Now place your main "fishbones" in place, the "5 M's" and the "E", laying it out as in the example chart above. If using a drawing board or flip chart, draw the slanted lines in place and label them, spacing each slanted "bone" apart so as to be able to place smaller "bones" on the main bones. Once your chart is prepared, you are ready to begin the "brain storm" session. Once prepared, your chart will begin to look something like this: It is important to prepare your group with the main theme that "NO IDEA OR THOUGHT IS STUPID!" Every idea should be presented, anything that pops into anyone's head should be brought out. Even if the one idea is not seen as appropriate to the group, it could very well trigger another thought or idea in someone else. Thus, it is imperative that you have your group understand, that there are no silly thoughts, no suggestions that should go unconsidered and everyone's ideas and input are needed. 4. The "brain storm" session should begin by discussing one of the main "bones" or categories individually. You need to get the group to focus on one category so as to consider every possible cause related to the one category. Should an idea develop that may not fit the category you are in, write it down and place it to the side for consideration and classification later. It is not good to stop and dwell long on one thought too long as other creative thoughts will be lost. 5. Once all ideas have exhausted on the one "bone", the group should move on to the next "bone. Sometimes, someone will have an after thought on the previous topic. This idea should be recorded and placed on the chart, then immediately return to the current category. To keep an orderly flow, do not allow members to jump all around the fishbone, instruct team members that if they have thoughts on a topic not yet being covered, to write that thought down on paper and bring up when that topic is discussed. 6. Once all of the categories or "bones" have been discussed and all ideas have been exhausted, the group now has to decide which may be most relevant to the problem being considered. The group now needs to decide which cause may be the most likely contributor to the problem. There are those who say that you should "cross-out" the ones deemed irrelevant, however, those thoughts could be useful in a future discussion of a different problem. Therefore, you should put a star, red dot, or whatever method you choose to highlight those causes the group has decided are most relevant to the problem. Do not destroy the other thoughts! 7. On a separate page, chart, or off to the side, it is time to prioritize the probable causes selected. Place either an "A" or number "1" by those that everyone agrees is a top cause of the problem. Place a "B" or "2" by those everyone feels may not be a most likely cause, but may have some significance. Place a "C" or "3" by those ideas that might be "unsure" or less likely to be a primary cause. 8. Now take the primary "A's" or "1's" and list those out as the primary reasons and now decide what activities could be taken to remedy the problem areas. It may be that more data must be collected, or more investigation into the cause would be needed before applying an action. The point is, you now have a starting point as to what the main causes could be, and ACTION ITEMS can be assigned. 9. Before the group disbands, action items should be assigned along with those persons responsible for the actions. Agree to meet again at a specified time and date to discuss and review actions taken. Data should be again collected to determine if the action put in place has resolved the problem. 10. DO NOT DESTROY any of the materials collected. All of the information and ideas should be gathered and stored for future reference and problem solving activities. CREATE A CAUSE-AND-EFFECT DIAGRAM EXERCISE To get the feel of this methodology, I recommend you do the following exercise yourself. Whenever I went anywhere to teach a group to use the Cause-and-Effect Diagram, I began with a sample exercise to get everyone in the mood and flow of performing the "brain storming" exercise. The sample exercise I use is taken from Dr. Kaoru Ishikawa's book "Guide to Quality Control". The exercise is one that most people know little or nothing about, and is not related to their process, but does give everyone the experience before performing the real session. I have also attached a copy of the "fishbone" diagram which is an Excel sheet that you can open and click on the links to add your own particulars. To open and save, or download the generic "fishbone" diagram, Click Here for a Blank Fishbone Diagram. FISHBONE EXERCISE In this class example, we are going to consider the problems behind a cooking process. Cooking rice is very similar to a production process in a factory. The rice (raw material) is washed (pretreatment), then placed in a pot (equipment) to be heated and steamed (second treatment). Thus we use a Cause-and-Effect diagram showing the steps necessary to cook good tasting rice. The current rice process is producing bland tasting rice. We are now going to consider what steps could be the problem behind our bad product. The Process Steps are: Raw Material - receiving and storage Pretreatment - washing and drying of the rice Cooking - equipment, pots, time vs. temperature, etc. Second Treatment - Steaming and precooking the rice Cooling and Packaging - Time, temperature and storage While there are no right or wrong answers, it is interesting to see what a group can come up with for original ideas into the problem. If you are doing this exercise alone, you should try to consider all the possibilities and enter them on your "fishbone" diagram that you create on your own paper.


Lesson #7 - Tool #4 - Ishikawa
Diagram
The best problem solving tool - the
“Fishbone” or
Cause-and-Effect Diagram

© The Quality Web, authored by Frank E. Armstrong, Making Sense
Chronicles - 2003 - 2016
THE POWER OF THE ISHIKAWA DIAGRAM
After collecting data from a process, and then preparing a pareto or histogram diagram, it's time to consider the reasons for the variation and those defects created. This data collected will reveal that items produced do not always turn out the same on a consistent basis. That is, parts produced can vary from production line to production line, from day shift to night shift, and from day to day, and so forth. In other words, you seldom get consistent parts produced every time. What causes these differences, or variation within the process? Basically, the variation created can originate from one or more of the following sources: 1. Raw Materials 2. Machinery, equipment or tooling 3. Work method or process 4. Work force - new people, trained different, etc. 5. Measurement method, or inconsistency in ways of measurement 6. Environment - high humidity, cold temperatures, dust, etc. The real problem becomes which one of the above factors is either totally, mostly, or somewhat responsible for the cause of our problem? Or is it a combination of several causes? A Cause-and-Effect diagram is useful in sorting out the causes of dispersion and organizing mutual relationships. This is an excellent team problem solving tool, where a team can gather together to "brain storm" the potential causes and resolutions to solve the variation problem. If you have not read the Introduction to Team Dynamics and Data Collection sections within this web site, I suggest you do so before proceeding further here. The Cause-and-Effect Diagram was created by Dr. Kaoru Ishikawa, an engineer and professor in Japan. The Cause-and-Effect Diagram is also referred to as a "Fishbone" diagram, getting the name from its resemblance to a fish skeleton when created. The main purpose of this diagram is to define a problem, identify a possible cause, isolate the cause, and then develop a solution. Below is an example of a generic Cause-and-Effect Diagram. STEPS TO CREATING A CAUSE-AND-EFFECT DIAGRAM When creating a "fishbone" diagram, each "vertebrate" is a section of one of 6 Basic categories. Once a main "fishbone" with six "bones" is created, each individual "bone" or section, can then be broken down further into another "fishbone" of individual items for analysis. The 6 basic categories are easily remembered from the anagram "5 ME". These basic categories are: 1. MAN - Does the operator have the proper training, experience, and ability to perform the function? 2. METHOD - Are the work instructions available and up-to- date? Do they reflect the best method to perform the task? Are the proper tools available? Are the process parameters specified clearly? 3. MACHINE - Does the machine have the capability to produce the product as specified? Does the machine have the ability to produce the product on a consistent basis? Are there regular routine maintenance and preventative maintenance tasks? Are they performed according to schedule? 4. MATERIAL - Are the correct materials available for the process? What is the quality of the material used in the process? Is there more than one supplier and does quality vary with different suppliers? What types of material problems could exist? 5. MEASUREMENT - Are the measurement instruments adequate for the process? Are they maintained correctly and regularly calibrated? Are the measurement instruments affected by environmental conditions such as temperature, vibration, dirt, etc.? 6. ENVIRONMENT - Is the manufacturing environment affected by temperature, humidity, dust and dirt, power fluctuations or seasonal differences? It is worth noting that within the measurement category, there can be variances. For example, the way one individual handles calipers and measures may differ from the next individual. It is important to have a training class for those who measure, to make the method of measurement consistent between all operators. Inconsistent measurement techniques can often lead you to believe that there are problems in the process, that may not actually exist. STEPS TO MAKING A TEAM CAUSE-AND-EFFECT DIAGRAM Again I recommend reviewing the Team Dynamics Introduction at the beginning of this web site. While one person can sit down and construct a "fishbone" diagram and go through the functions, it is wiser to form a team to "brain storm" the process. Gathering a cross-functional team of 4 - 7 individuals is the best and recommended process. It is also useful to include a "neutral" person who is not familiar with the process. The reason for that is this person will try to familiarize themself with the process, and in doing so, ask many questions that may spark an idea amongst the group. This neutral person may also present ideas and viewpoints that others may not consider. Appoint someone to be in charge of drawing the diagram. It is recommended that you use either a drawing board, a flip chart, or gather some large poster paper to draw the diagram on. You may also utilize "Post-It" Notes on a wall, if none of the above items are available, laying those post-its out in a fishbone arrangement. Whatever method you choose, it should be available for all to see. GETTING STARTED 1. First, formulate the problem and write it in a box on the right side of the diagram. Everyone must clearly understand the nature of the problem and the process/product being discussed. If everyone is not clear on the purpose of the session, the session will not resolve the problem. 2. Next, draw an arrow from the left side of your chart or board, over to the right side and make and arrowhead point. To the right of the arrowhead, place your "problem" topic. This arrow is called the "EFFECT" arrow. 3. Now place your main "fishbones" in place, the "5 M's" and the "E", laying it out as in the example chart above. If using a drawing board or flip chart, draw the slanted lines in place and label them, spacing each slanted "bone" apart so as to be able to place smaller "bones" on the main bones. Once your chart is prepared, you are ready to begin the "brain storm" session. Once prepared, your chart will begin to look something like this: It is important to prepare your group with the main theme that "NO IDEA OR THOUGHT IS STUPID!" Every idea should be presented, anything that pops into anyone's head should be brought out. Even if the one idea is not seen as appropriate to the group, it could very well trigger another thought or idea in someone else. Thus, it is imperative that you have your group understand, that there are no silly thoughts, no suggestions that should go unconsidered and everyone's ideas and input are needed. 4. The "brain storm" session should begin by discussing one of the main "bones" or categories individually. You need to get the group to focus on one category so as to consider every possible cause related to the one category. Should an idea develop that may not fit the category you are in, write it down and place it to the side for consideration and classification later. It is not good to stop and dwell long on one thought too long as other creative thoughts will be lost. 5. Once all ideas have exhausted on the one "bone", the group should move on to the next "bone. Sometimes, someone will have an after thought on the previous topic. This idea should be recorded and placed on the chart, then immediately return to the current category. To keep an orderly flow, do not allow members to jump all around the fishbone, instruct team members that if they have thoughts on a topic not yet being covered, to write that thought down on paper and bring up when that topic is discussed. 6. Once all of the categories or "bones" have been discussed and all ideas have been exhausted, the group now has to decide which may be most relevant to the problem being considered. The group now needs to decide which cause may be the most likely contributor to the problem. There are those who say that you should "cross-out" the ones deemed irrelevant, however, those thoughts could be useful in a future discussion of a different problem. Therefore, you should put a star, red dot, or whatever method you choose to highlight those causes the group has decided are most relevant to the problem. Do not destroy the other thoughts! 7. On a separate page, chart, or off to the side, it is time to prioritize the probable causes selected. Place either an "A" or number "1" by those that everyone agrees is a top cause of the problem. Place a "B" or "2" by those everyone feels may not be a most likely cause, but may have some significance. Place a "C" or "3" by those ideas that might be "unsure" or less likely to be a primary cause. 8. Now take the primary "A's" or "1's" and list those out as the primary reasons and now decide what activities could be taken to remedy the problem areas. It may be that more data must be collected, or more investigation into the cause would be needed before applying an action. The point is, you now have a starting point as to what the main causes could be, and ACTION ITEMS can be assigned. 9. Before the group disbands, action items should be assigned along with those persons responsible for the actions. Agree to meet again at a specified time and date to discuss and review actions taken. Data should be again collected to determine if the action put in place has resolved the problem. 10. DO NOT DESTROY any of the materials collected. All of the information and ideas should be gathered and stored for future reference and problem solving activities. CREATE A CAUSE-AND-EFFECT DIAGRAM EXERCISE To get the feel of this methodology, I recommend you do the following exercise yourself. Whenever I went anywhere to teach a group to use the Cause-and-Effect Diagram, I began with a sample exercise to get everyone in the mood and flow of performing the "brain storming" exercise. The sample exercise I use is taken from Dr. Kaoru Ishikawa's book "Guide to Quality Control". The exercise is one that most people know little or nothing about, and is not related to their process, but does give everyone the experience before performing the real session. I have also attached a copy of the "fishbone" diagram which is an Excel sheet that you can open and click on the links to add your own particulars. To open and save, or download the generic "fishbone" diagram, Click Here for a Blank Fishbone Diagram. FISHBONE EXERCISE In this class example, we are going to consider the problems behind a cooking process. Cooking rice is very similar to a production process in a factory. The rice (raw material) is washed (pretreatment), then placed in a pot (equipment) to be heated and steamed (second treatment). Thus we use a Cause-and-Effect diagram showing the steps necessary to cook good tasting rice. The current rice process is producing bland tasting rice. We are now going to consider what steps could be the problem behind our bad product. The Process Steps are: Raw Material - receiving and storage Pretreatment - washing and drying of the rice Cooking - equipment, pots, time vs. temperature, etc. Second Treatment - Steaming and precooking the rice Cooling and Packaging - Time, temperature and storage While there are no right or wrong answers, it is interesting to see what a group can come up with for original ideas into the problem. If you are doing this exercise alone, you should try to consider all the possibilities and enter them on your "fishbone" diagram that you create on your own paper.